
Data Collection with an IoT Device
Brief
Create an Internet-connected device using at least 2 sensors. The choice of sensors is up to you, it can be anything from a button or a potentiometer to .... This device will collect data in your house for a week. Consider where it's going to be installed, how it's going to be powered. Are there any mechanical components you need to add to translate action to your sensors (levers, pulleys, springs, etc)? How often will you be saving this data to the database - consider both the limitations (no more than 30 data points per feed on AdafruitIO, for example) and the necessity (do you need repeated values or only the changed ones.)
Initial Idea: Fridge
I love eating. Eating is what makes me happy, and how I reduce my anxiety. I love drinking too. Any liquid can work. I always have to have a multiple choice of drinks by my side. Also, I love cooking. This means that I open my fridge a lot. So, why don’t I collect a data of how often I open my fridge?
Since the light inside of my fridge turns on whenever I open my fridge, I thought putting my ESP32 with light sensor would be a great idea. Addition to it, I wanted to see if the temperature setting of my fridge was actually working. I have trust issues.
After overcoming of a couple wiring issue and two burned finger due to a misuse of a resister, finally my Arduino code, Audafruit feeds, and ESP32 were working together. Then I placed my ESP32 in my fridge. Let’s see how it went.
Immediate fail
Even though it was technically “working,” I immediately realized that this would not go well for me. As you can see in the image below, my ESP32 was connected to my portable charger since there is no power outlet inside of my fridge. I have no problem charging my other electric devices with this charger, but for some reason it stopped sending power to my ESP32 after 3 minutes, which forced me to go open my fridge every 3 minutes to reconnect them again. It was not sustainable, and I wanted to sleep at some point.
After the fail, I was also temped to just connect my ESP32 to one of my laptops, but I couldn’t afford to risk breaking $1,300 laptop by leaving it inside of my fridge for 7 days. So, I had to change my plan.

ESP32 safely placed in my fridge - don’t mind my beer
Next Idea: Just Kitchen
Even though my initial plan of collecting data of how often I open my fridge failed, it didn’t change my love for food. My next move was to place my ESP32 next to the stovetop, so that I could collect data of how often & how long I stay in kitchen for or what time I usually go search for food by using the light sensor, and how often I actually cook by using the temperature sensor.

ESP32 placed next to my stovetop area
First Two Days
The first couple of days made me a little bit anxious because I realized that I was out of home most of the time. It was a final’s week, and I spend most of my day at campus or cafe. Since I didn’t use my kitchen that often during that time and my kitchen doesn’t have window or any other major light source without me being present there, the sensor kept sending 0 to my Adafruit Feed. Also, there was a couple glitch on my temperature sensor which made the data look somewhat skeptical.

7 Days of Data Collection
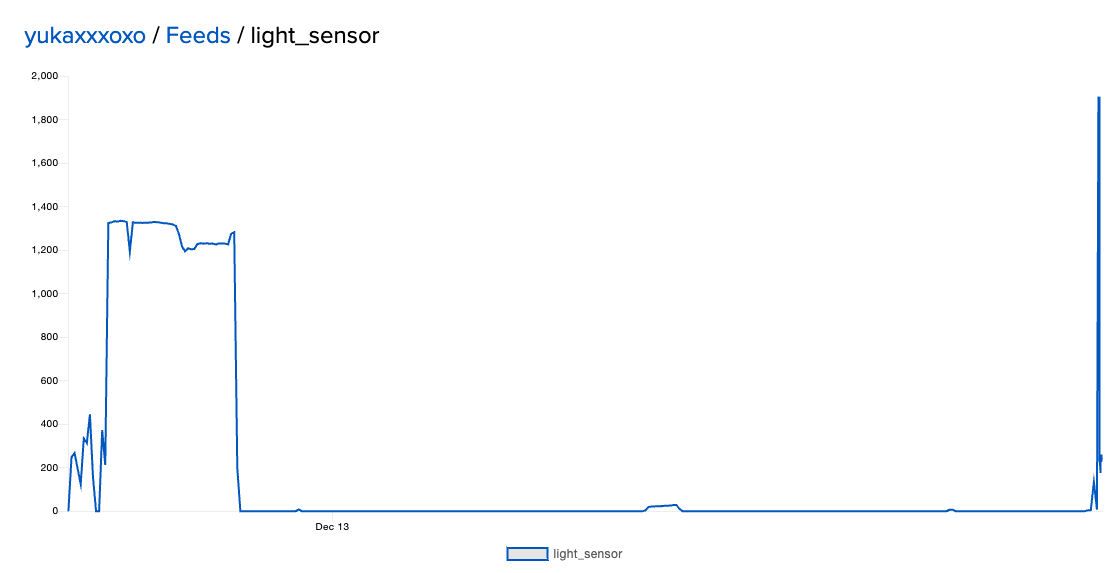
I collected the data for seven days straight, and here are the results:


The light sensor shows that I spent a quite time in the kitchen each day. What happened in December 17th is most likely that I left the house with my kitchen light on.
Temperature sensor doesn’t show much difference, but it still shows that usually when I’m in the kitchen temperature goes up a little since I used the stovetop to cook something. Since December 18th, I started to turn the heater on since it was getting a little chilly and rainy which makes sense that the temperature average is higher than the week before.
Data Visualizations
With the data I collected, I started visualizing the results. I started playing with the data to make sure that it actually reflects thte data by using p5js.com,
This video shows what happens when I turned on the light for a couple seconds to confirm that it works. The white circle reflects the light sensor, and the blue one is the temperature sensor. It reflects the last 5 data and has a timestamp in its code to make sure that it collects what I’m really trying to collect. However, the temperature doesn’t change too much in a short period of time, it kinda looks boring.
This is the second attempt where I added animation so that it looks more engaging and is more fun to watch. Since I used minValue, macValue, minSize, and maxSize, even the blue circles for temperature sensor moves in a certain way this time.
I personally like the second attempt more because it moves, but the first one was more accurate in terms of reflecting the data,
Reflect
Although I had no idea what I was doing for the first couple of days and had to change my plan, it was fun to see how often I use my kitchen. I have ADHD and I forget to turn off lights pretty often, so I see this project as something I can benefit in the future. :)